Raptor Innovation Summit 2026 — Registration is Live

Getting Started with Raptor Fault Manager
When implementing any embedded system, it’s important to assess its health. While detection is essential, it’s even more so in order to prevent catastrophic behavior during modes of failure and alert users/other parts of software that the system is failing. We created the Raptor Fault Manager to enable the user to easily detect faults, mitigate failure and broadcast fault statuses in automotive applications.
New Eagle offers fault management in two flavors: The OBD Fault Manager and the Standard Fault Manager. Raptor OBD Fault Manager helps with efficient application development targeting emissions regulations such as CARB CCR 1968.2 (Light-Duty Automotive) or CARB CCR 1971.1 (Heavy-Duty Vehicles). The Standard Fault Manager provides a simple interface for defining and maintaining faults and their states in your application. A simple fault management architecture can be seen as such:
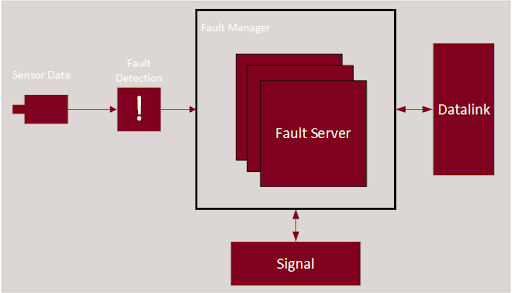
Some sensor data is read in with logic to detect a fault is a typical use case for fault detection. The user can utilize the Raptor fault-management blockset to alert the fault manager of the fault state which provides the ability to reference faults and their states across the application. From there, you can signal to other parts of the application as well as the user of your system that a fault has occurred. By using the OBD Fault Manager blockset and the Raptor J1939 blockset, fault diagnostic message (DM) blocks can access the fault server and this information in data-link messages with little implementation effort by the developer.
Raptor Fault Manager Use Case
Follow along in this Raptor Fault Manager example where you can track the fault status on a simple “sensor” that we emulate through XCP using Raptor-Cal. For simplicity, this example model and the explanations below use the ‘Standard’ Raptor Fault Manager instead of the OBD version. The OBD version has many more fault states as required by the standards. Our example system will read in sensor data, detect faults in that sensor’s data, update the states of the fault and alert the user of the fault. Please note that any Raptor ECU can be used for fault management.
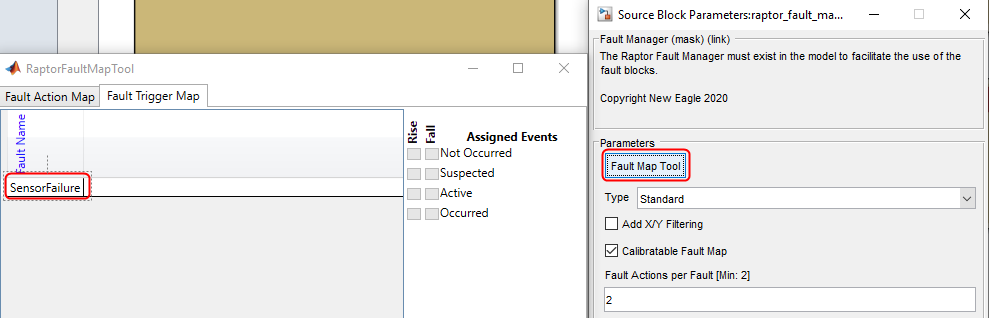
To begin, simply add the “Fault Manager” block to the model:
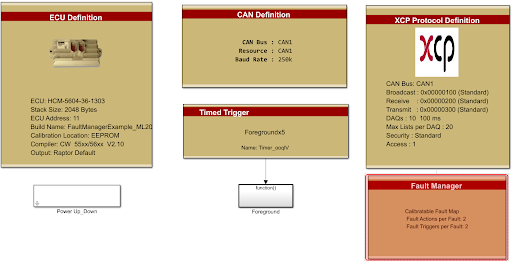
The Raptor Fault Manager is required in order to use the other Raptor Fault blocks throughout the model. It stores and manages each of the fault definitions, actions and triggers the designer may add to the application. By default, the Raptor Fault Manager uses a Standard fault configuration type propagating the Raptor Fault Definitions with the basic capacities: Active, Suspected and Occurred. These are described as:
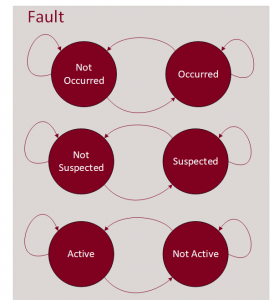 Active – A fault is set to ‘active’ when X counts are equal to or greater than Y counts
- Suspected – A fault is set to ‘suspected’ when X counts exist but are less than Y counts–when “Add X/Y Filtering” is enabled
- Occurred – A fault is set to ‘occurred’ when a previously active fault now does not match or exceed the X count threshold
In this example, we will omit the use of X/Y filtering and apply our own filtering using similar logic. Since the logic is very similar, it would make more sense to use the X/Y filtering. However, this leaves room for the implementation of more complex fault filtering.
In addition to filtering, Raptor-Dev faults have three additional behaviors:
- Disabled – The fault will not be enabled even if the X and Y conditions are met.
- Sticky – Once a sticky fault is set, the fault remains in this state until the next power cycle. This fault can also be manually cleared.
- Persistent – Once a persistent fault is set, the fault remains in this state across power cycles. This fault must be manually cleared.
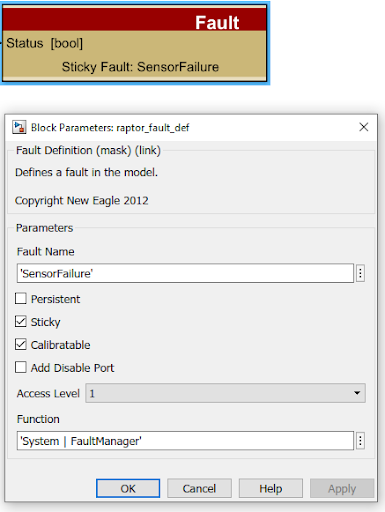
Now that the Fault Manager has been added to the project, we can add our fault. We will do this by adding a “raptor_fault_def” block from the library browser (under Raptor/Faults). We will use this fault to detect the state and modes of failure for our “sensor”.
The “Fault Name” is used for tracking a fault relevant to our application so these names need to be unique. In our example, we will name it “SensorFailure” and will make this “sticky”. In addition to this, let’s add “calibratable,” so that we can override the states of this fault.
Now when you check the Fault Manager’s Fault Map Tool, you can see the fault:
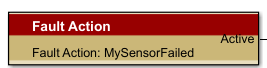
Once the fault is established, we can add Fault Triggers and/or Fault Actions. The output of these blocks is configured in the Fault Map Tool mentioned above. The Fault Map Tool can be used to set up the default or initial value for Fault Triggers or Fault Actions. They are typically managed via calibration in a production setting. We will add a Fault Action block and provide it with a unique Fault Action name: “MySensorFailed”:
In the Fault Map tool, under the Fault Action Map, we can see our fault action.
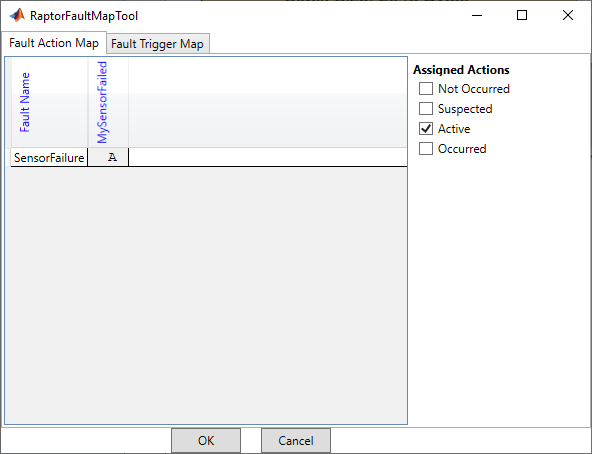
The “Assigned Actions” are logically or’d together and control the output of the Fault Action block. We will set this to “Active,” such that whenever the “SensorFault” we defined is “Active,” our “Fault Action” block will output a 1. The Fault Trigger Map works similarly for Fault Triggers; however, Fault Triggers provide a function call as their output rather than a boolean value. Faults can affect multiple Fault Actions and Fault Triggers. This is the “Signal” portion of our fault system architecture.
With a Fault and Fault Action established, we are able to apply our custom fault filtering. We will look at our sensor’s output and verify it is within a certain range. Since this is a hypothetical sensor, we will make up a range to be between -1 and 4501.
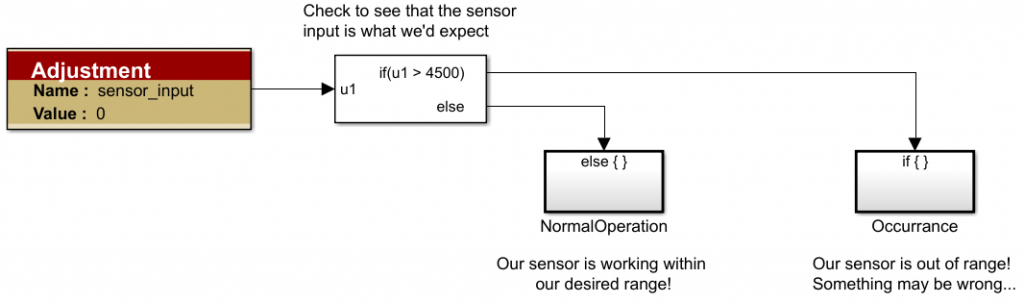
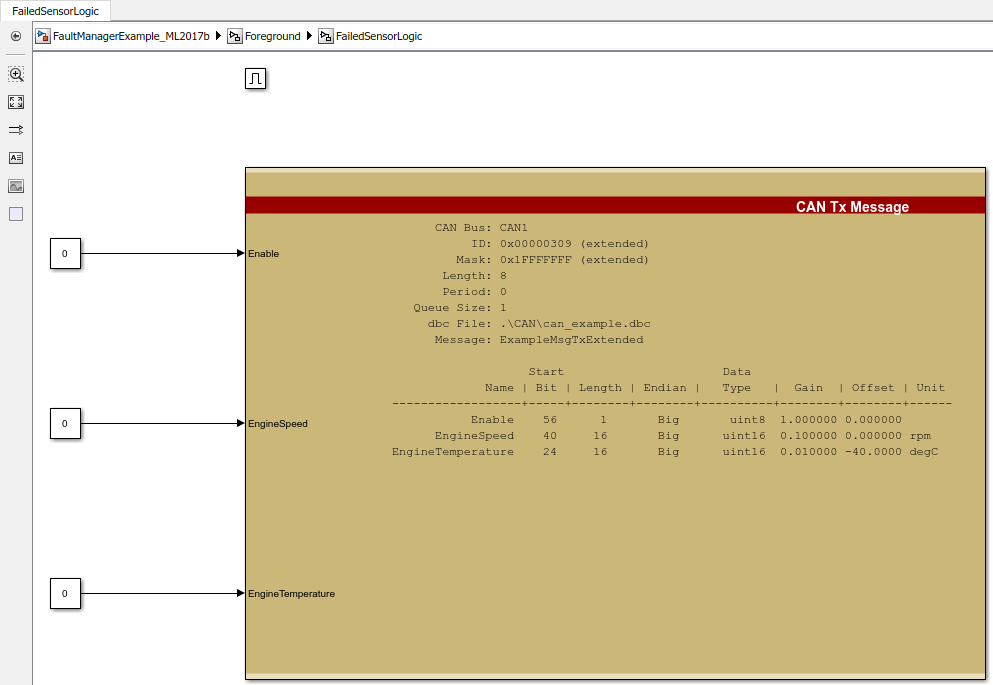
When the sensor is within range, we will execute some action that would imply operations are normal. For our sample application, we will simply output a single CAN message with data:
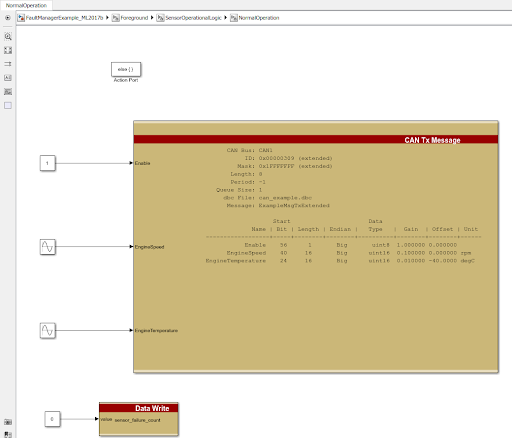
If the sensor is outside of that range, we will increment a counter:
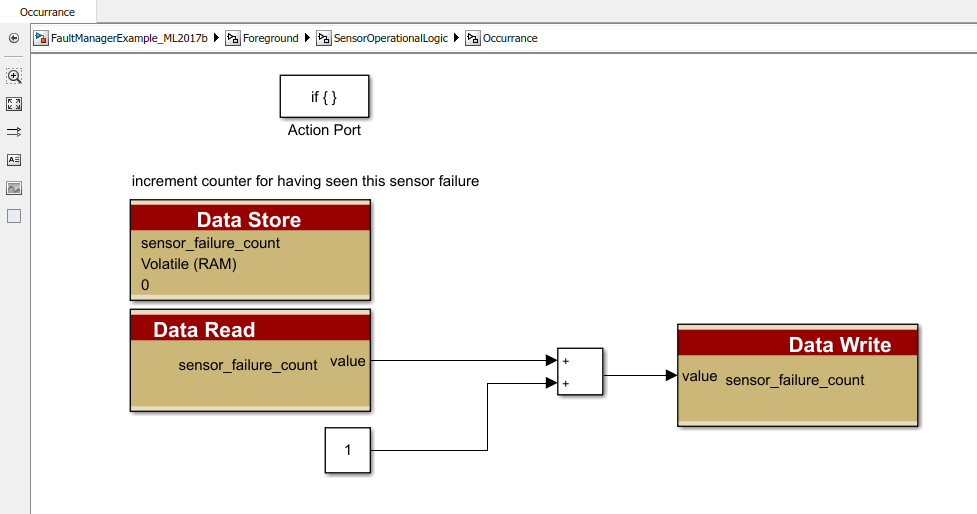
Filtering is the first building block for fault detection. Fault filtering can be done in many ways and is entirely a design choice. From this counter, we are able to implement a primitive filter:
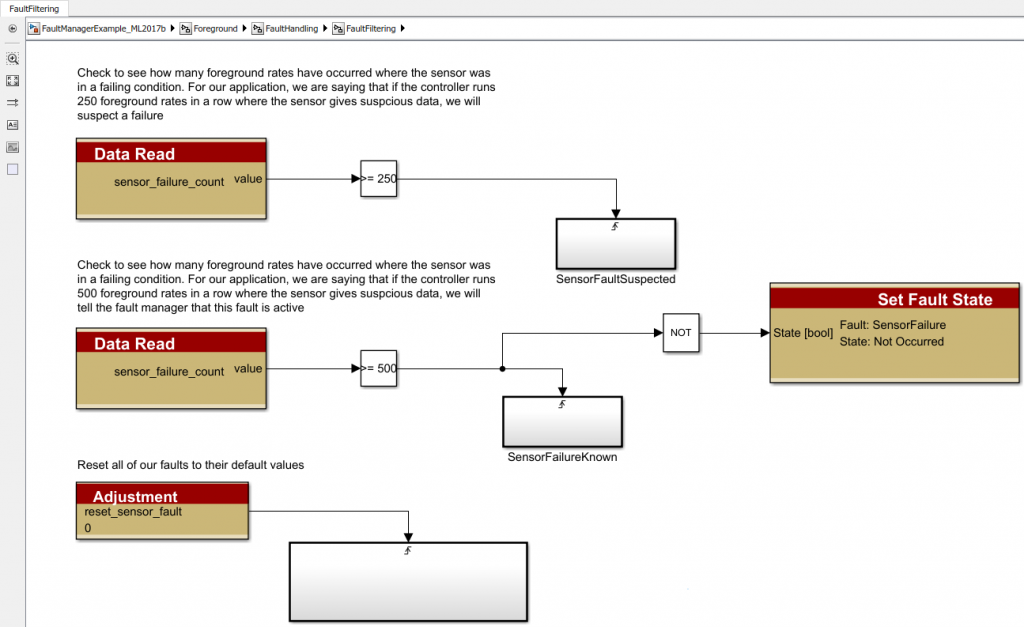
We can check the value of the counter or any filter you want and update the fault status of the block. In our application, we are assuming the fault is suspected if the sensor is out of range 250 foreground rates in a row. It is considered active if it occurs >= 500 times in a row.
It is great to detect the faults but now we must act on that detection. We can use the Fault Action block to control our application based on whether-or-not the sensor is operating correctly. The Fault Action block will output a logical 1 when the fault is “Active” which we configured in the “Fault Map Tool”. You can also use the “Fault Trigger” block for similar functionality but for the sake of simplicity, we will only use the “Fault Action” block.
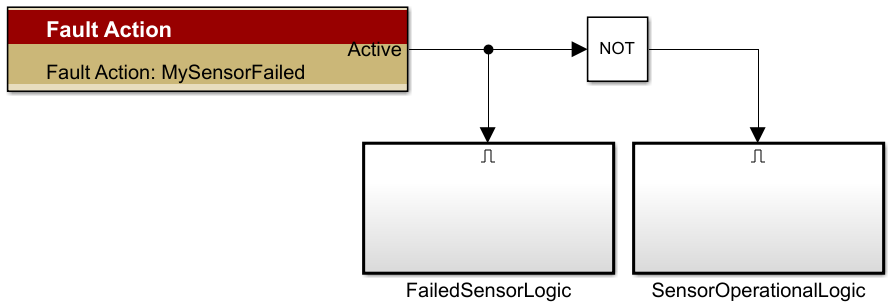
When the sensor is operational, we will output a CAN message that indicates the system is running correctly and reset the fault counter. The use of this CAN message isn’t important but rather an example of logic that could run under working circumstances.
When the sensor fault is active, we will alert the system by outputting the same CAN message with hypothetical data indicating a fault. Again, this action is particular to our application.
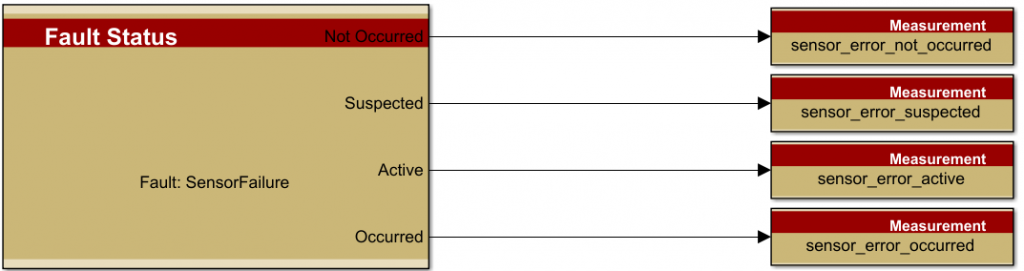
For more fault signaling, you can use the “Fault Status” blocks to determine the current states of your fault:
In this example, we have successfully
- “Read” sensor data (“MySensor”)
- Defined a Fault (“SensorFault”)
- Applied a custom filter to the sensor data to detect signal abnormalities (“sensor_failure_count”)
- Acted on signal abnormalities (“Fault Action” block)
- Created logic to alert the system users about the occurrence of the fault
- Mitigated the fault by providing alternative system logic during fault conditions
While this was a simple example, you can create more complex fault filtering techniques as well as explore the use of different blocks for handling faults throughout your controller software. We hope that this Raptor Power User Tip has provided an overview of Fault Management using Raptor and a working example that you can load on to your hardware to see how it works for yourself.