Raptor Innovation Summit 2026 — Registration is Live
Understanding The Raptor Application Monitor Tool
The Application Monitor is a tool within Raptor-Dev that adds continuous run-time checking within your running application. It’s a useful tool for Embedded Model-Based Design (eMBD), especially if you begin to push the limits of the embedded hardware. Debugging software created in Simulink with Raptor is a little different than debugging a text-based programming language (like Python, C/C++, or MATLAB). For one, the generated code created from a Simulink model with Raptor generally won’t be familiar to the author of the model, which is kind of the point. It is the power of code generation that lets you go fast not having to worry about the detailed code. Secondly, the built software is programmed onto a sealed electronic control unit (ECU) with no hardware debugging attachments. Thankfully, with a robust, validated tool like Raptor-Dev and the proven code-generation technology from The Mathworks, the kinds of issues that require a hardware debugger are resolved already and available in the proven software blocks for your use.
Debugging an application without these debugging tools could be as simple as toggling an output on the ECU or changing the state of the system to something you would expect; however, some errors are more difficult to track down such as those in memory management which can cause intermittent microcontroller resets and other non-deterministic behavior. The App Monitor comes in handy when the system can’t be debugged by traditional debugging methods.
No controls system engineer wants to tote around a bricked module. Using the App Monitor offers a way to determine what might be resetting the processor by pausing the application during runtime. By stopping the application before a reset, the state of the module is available to be seen by the user. When the application is stopped, user-accessible variables are available for viewing.

How Do I Use The Application Monitor?
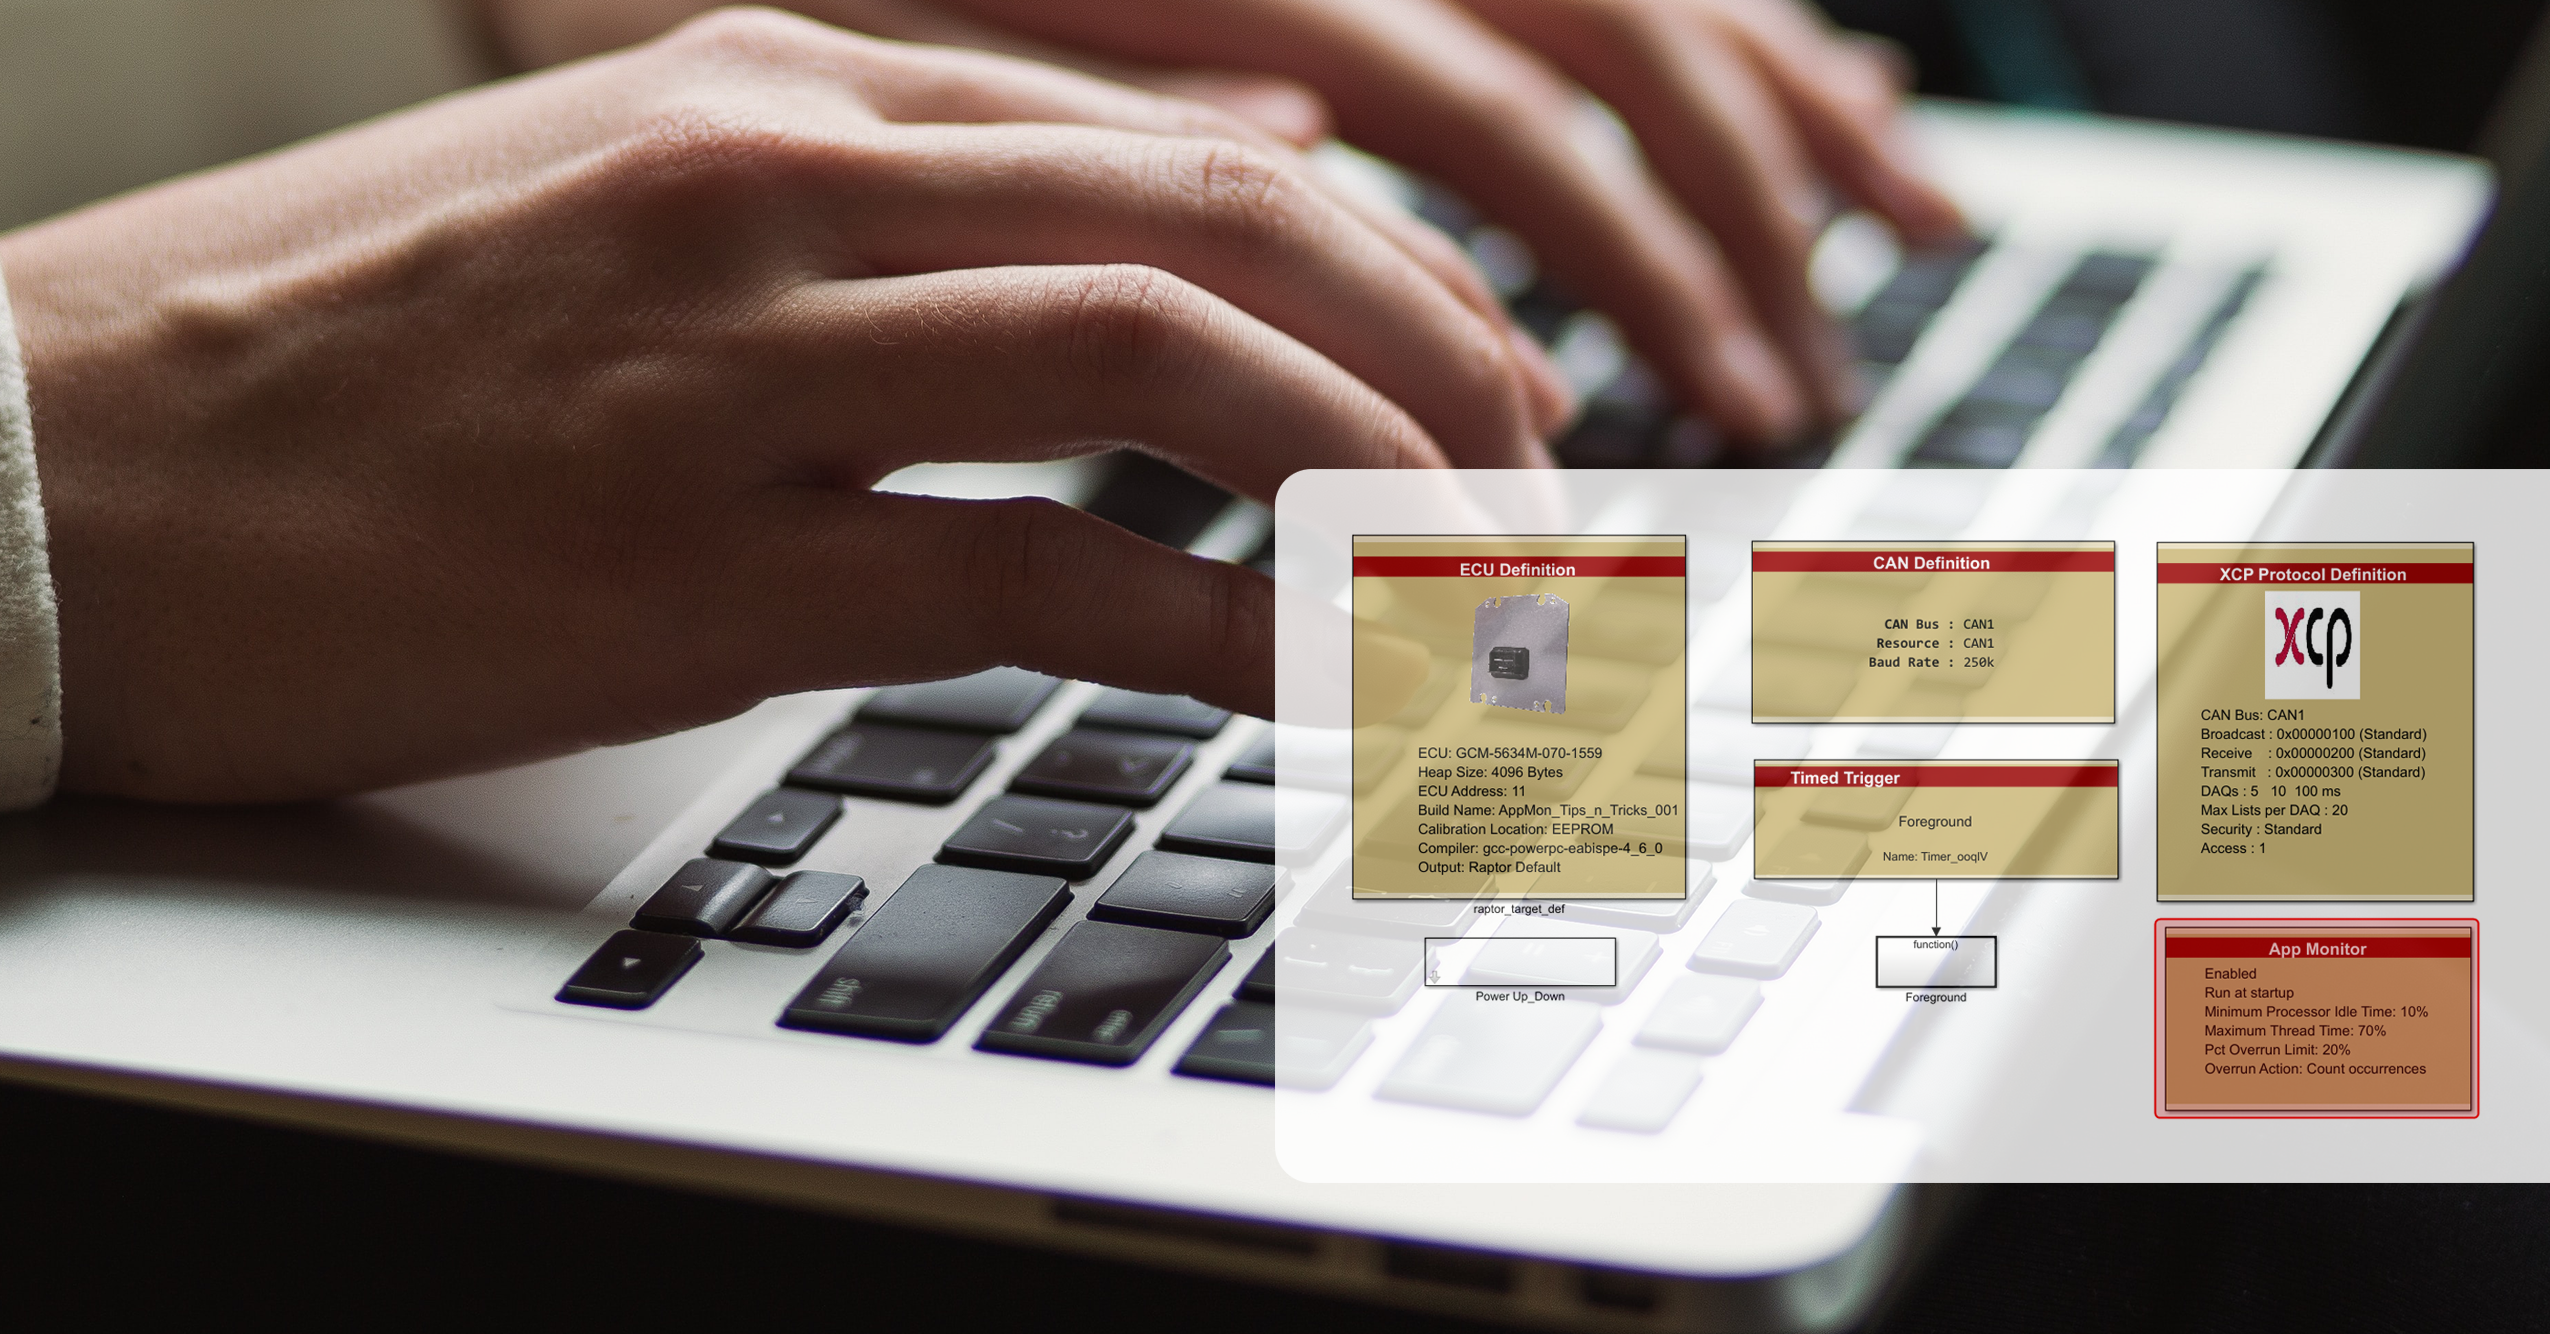
By creating a model and simply dropping the “App Monitor” block onto the top-level system, we’ve done most of the heavy lifting.
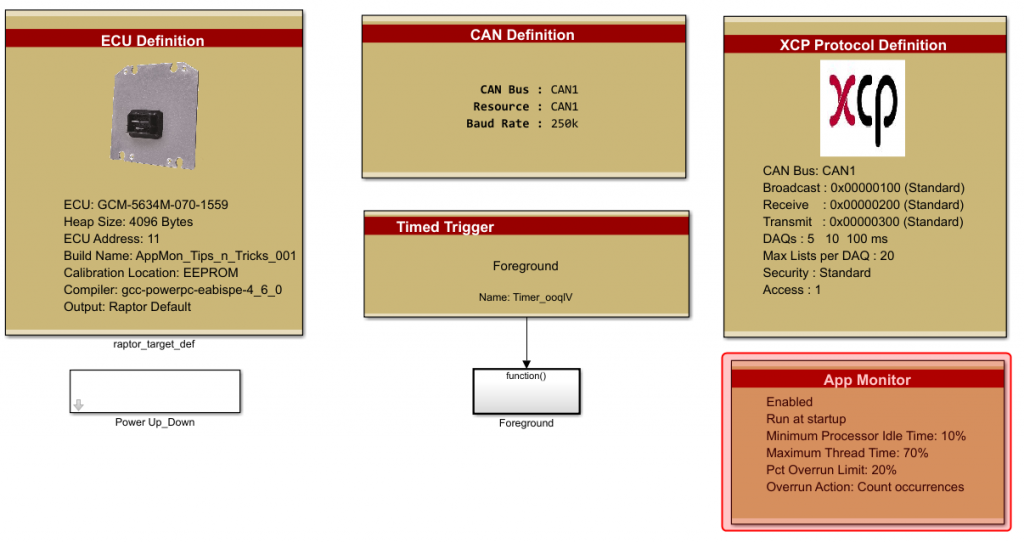 The parameters are as follows:
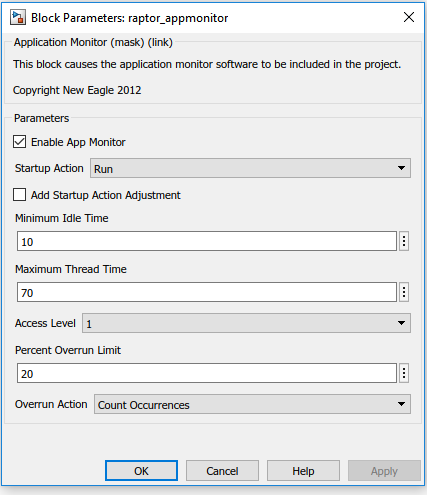
- Enable App Monitor: The benefit of being able to control this is to easily remove debugging features in a production code build, after testing, such as with a script.
- Startup Action:
- App Monitor Disabled: Causes the App Monitor to be disabled (can also be set through calibration – see next parameter).
- Run: Runs the software on startup
- Pause: Pauses the software on startup
- Add Startup Action Adjustment: This adds a calibration in Raptor-Cal under “Startup” that can be configured:
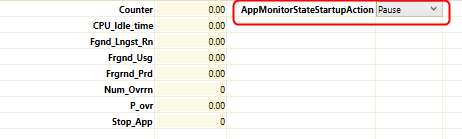
- When set to pause, the application will pause on startup, as seen here. The foreground counter is at 0. The idle time is 0% because the application has never entered the foreground loop that updates this variable. Otherwise it would be at 100%.
- Minimum Idle Time: The minimum percent of time that the processor can be idle before the App Monitor pauses the application.
- Maximum Thread Time: The maximum percent of time that any particular thread may be active before the App Monitor pauses the application when checked against the Percent Overrun Limit.
- Percent Overrun Limit: The percent of time a thread may be above the maximum thread time.
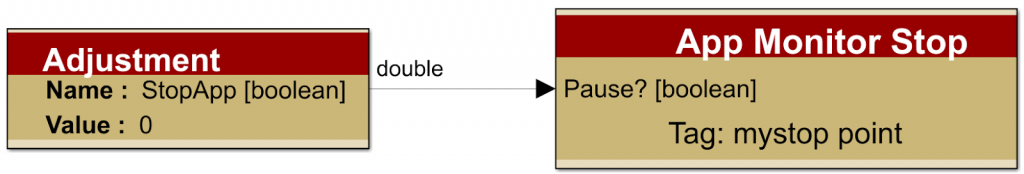
Within our model, we’re able to add more App Monitor logic that can give insight into CPU usage. The blocks shown below allow accessing App Monitor information at runtime. We’ll start by adding a few blocks. Stop the application by toggling “App Monitor Stop”. This kind of control is powerful if you can generate logic to stop the application when you prefer (for instance, by setting this stop point within a particular function call). This tag is viewable in Raptor-Cal.
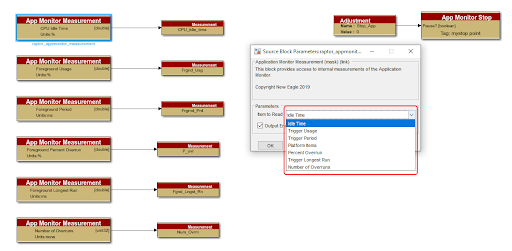
 While stopping the application can help, the ability to see the underlying system parameters is more helpful. You can access this information by using the “App Monitor Measurement” block.
 Various measurements include:
- Idle Time: The measured percent of time that the processor is idle.
- Trigger Usage: The percent of the scheduled time rate that the last execution of this rate task consumed. In this example, we have selected the “Foreground”. On all modules, the foreground trigger is fired every 5ms by default — except for the BCM48 and display, where the foreground rate default is 10ms.
- Trigger Period: The measured amount of time since the last firing of a trigger.
- Platform Items: On certain ECUs there are additional application monitoring data that is exposed by the base software. These platform-specific items are in this area.
- Percent Overrun: The measured percent of time that a thread has overrun its time schedule.
- Trigger Longest Run: The longest task execution time, measured in milliseconds.
- Number of Overruns: A count of the number of times that a thread has exceeded the amount of time it’s allowed to run.
 Adding these measurements to the model provides a simple application to show the inner-workings of the application, which is available for download.
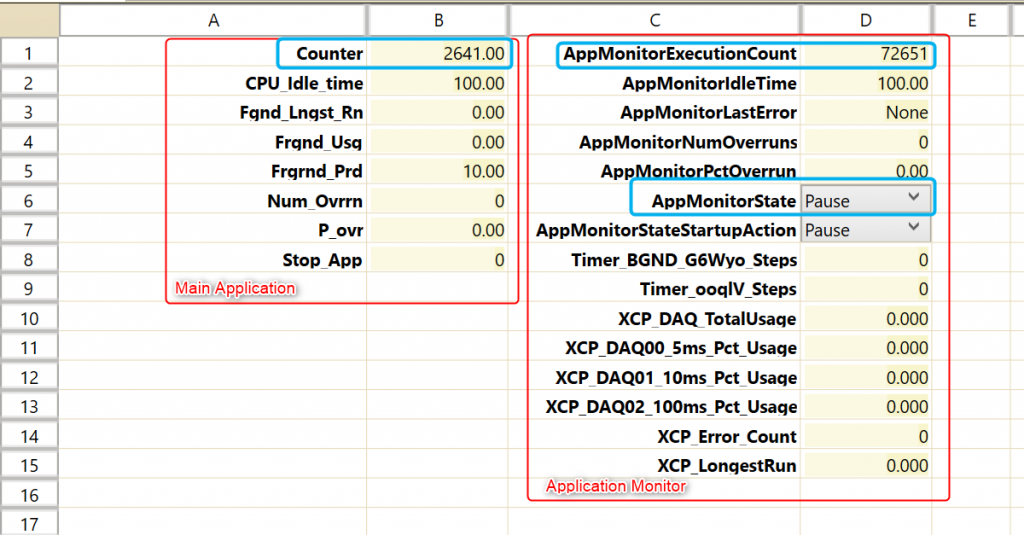
For this demonstration, you can configure the App Monitor calibrations in Raptor-Cal to see how it works. In this screenshot, notice the main application counter is significantly lower than the AppMonitorExecutionCount (App Monitor execution counter) when the AppMonitorState is set to “Paused” (pausing the application).
What To Take Away?
The Application Monitor allows for application debugging in settings where conventional debugging methods can’t help you. By stopping an app and/or seeing thread usage within the app, you can take better steps toward getting your application up and running.